Custom reports
Overview
You can create your own custom reports in Tableau. We have made available a number of data sources that you can use for this purpose. These data sources are located in the CustomReportDatasource folder, which you can access from the Explore page.
The data sources are explained in Data sources, below.
A data dictionary is available that provides descriptions of the fields available in the data sources. It is located in the DataDictionary folder, which can be accessed from the Explore page.
For information about using Tableau Online, see the Tableau Online Help.
Best practices
- Use the shortest possible timeframe that allows you to create the report that you want.
- Use the most appropriate data source for your report. Using a data source (such as all data) that is larger than required will cause performance issues.
- NAGRA operates a fair usage policy – long-running or inefficient queries will be cancelled by the server.
Creating a custom report
To create a custom report:
- Log in to Tableau Online.
- Go to the
Explorepage. - Open the
CustomReportDatasourceproject. - Click the appropriate data source for the report you want to create (see Data sources, below).
- Click New Workbook.
- Use the available dimensions and measures to create your report.
- Click File > Save As...
- Save the worksheet into the appropriate project.
- Navigate to the folder where you saved the worksheet, then open it and make sure it displays what you wanted.
Example
To create a report that shows account creation over time (similar to the Account creation report):
- Create a new workbook as explained above using the
ds_account_actvity_device_entitlement_relationdata source. - Drag
accountidfrom the Dimensions list into the Rows shelf. - Right-click
accountidin Rows and select Measure > Count (Distinct). - Drag
Createddatetimefrom the Dimensions list into the Columns shelf. - Right-click
Createddatetimein Columns and select the second Day option. - Click File > Save as... and save the worksheet to a convenient location.
- From the
Explorepage, navigate to your new worksheet and open it.
This creates a very simplistic report, with no colouring, filters, calculated fields, etc. Have a look at the way the NAGRA-supplied reports are constructed to see this additional functionality. (For example, in any report, you can click Edit at the right-hand side of the toolbar, then save a copy that you can play around with.)
Data sources
Accounts
Data source name: ds_ts_nxtGen_account_based_data_all
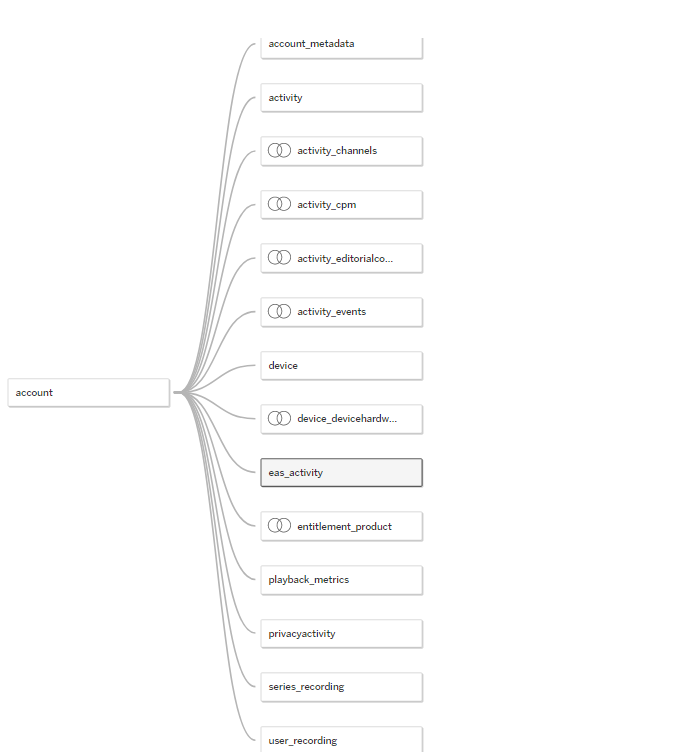
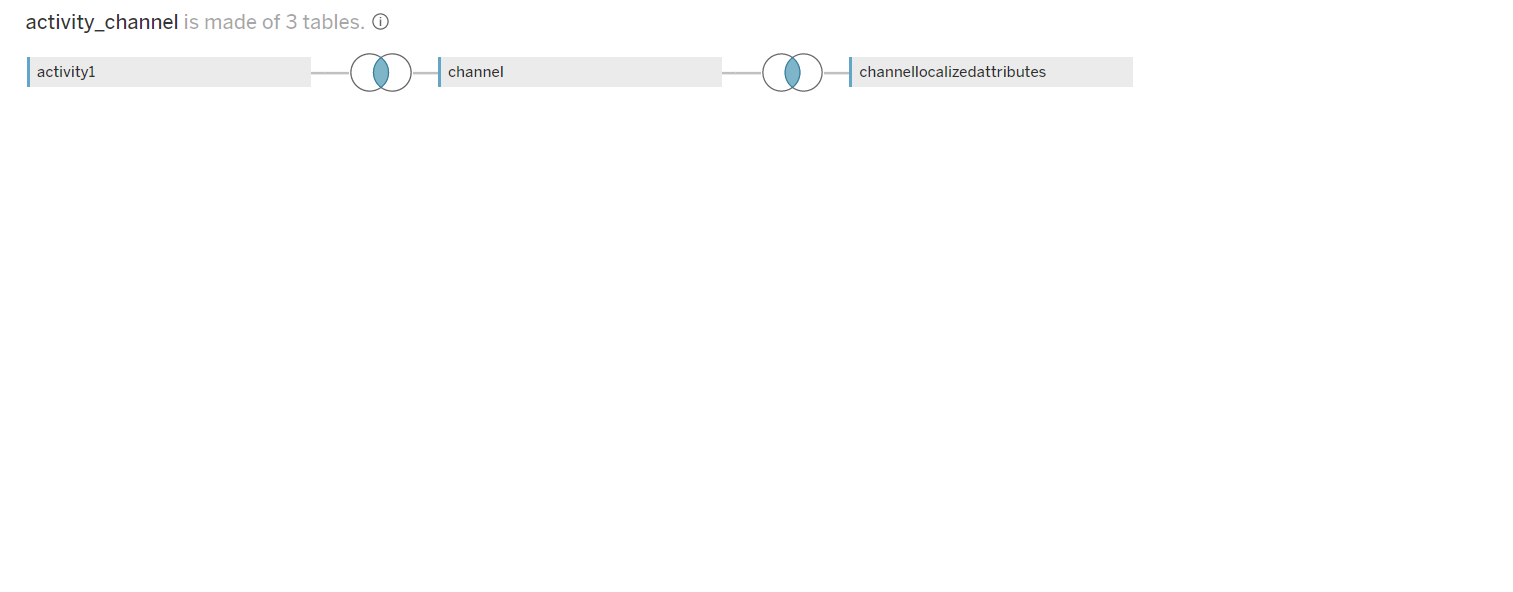
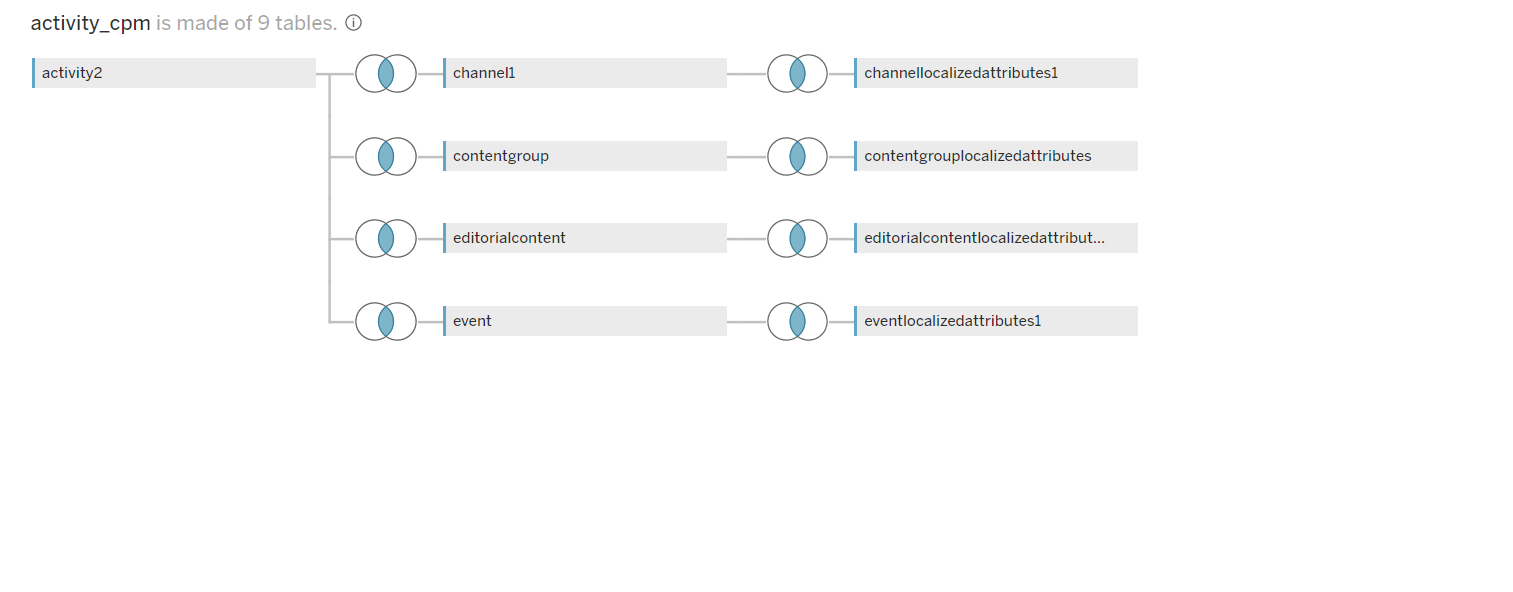
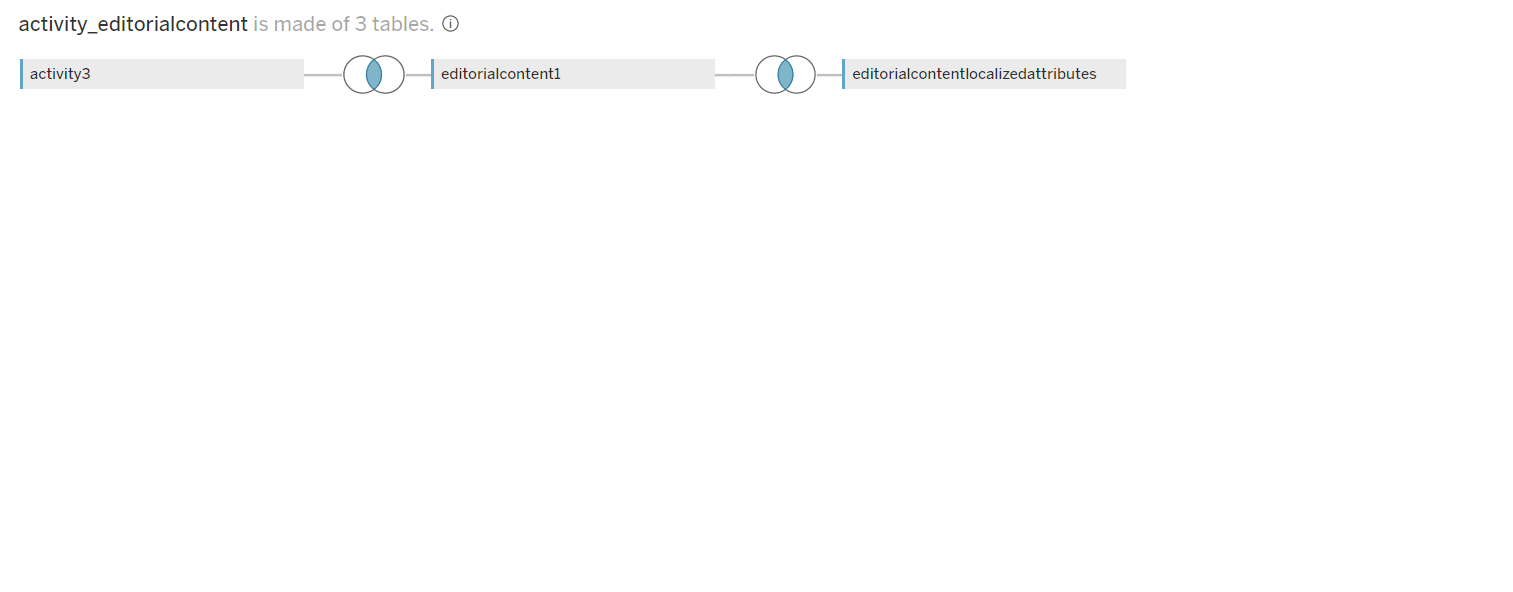
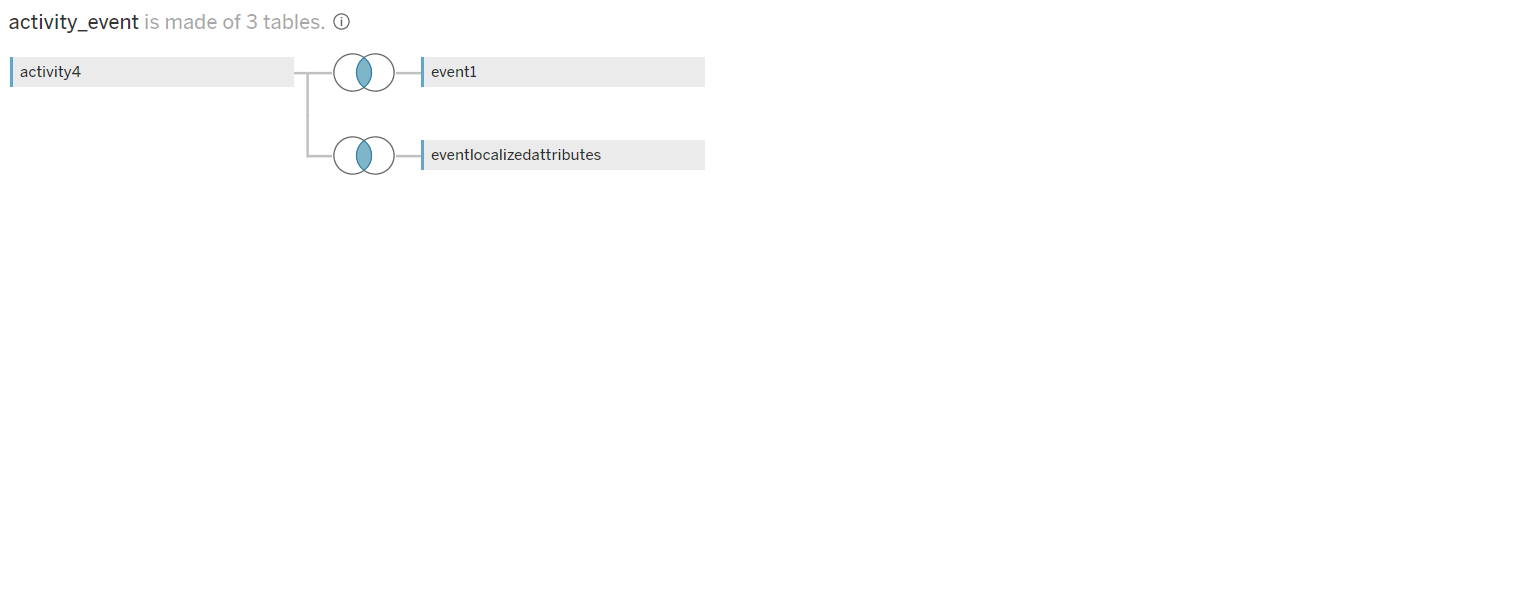
| Logical layer – data source ds_ts_nxtGen_account_based_data_all | Physical tables (only with joins) |
|---|---|
|
|
| |
| |
| |
|
Devices
Data source name: ds_ts_nxtGen_device_based_data_all

Entitlements
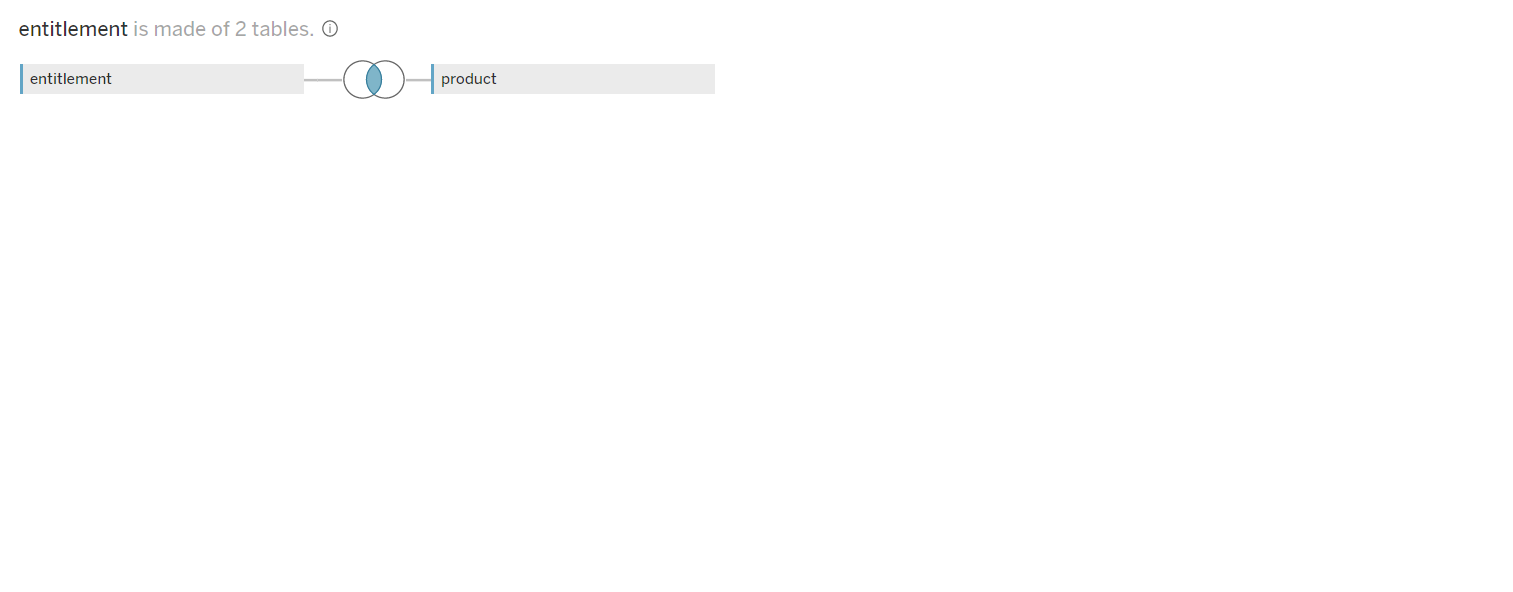
Data source name: ds_ts_nxtGen_entitlement_based_all

Activity
Data source name: ds_ts_nxtGen_activity_based_data_all
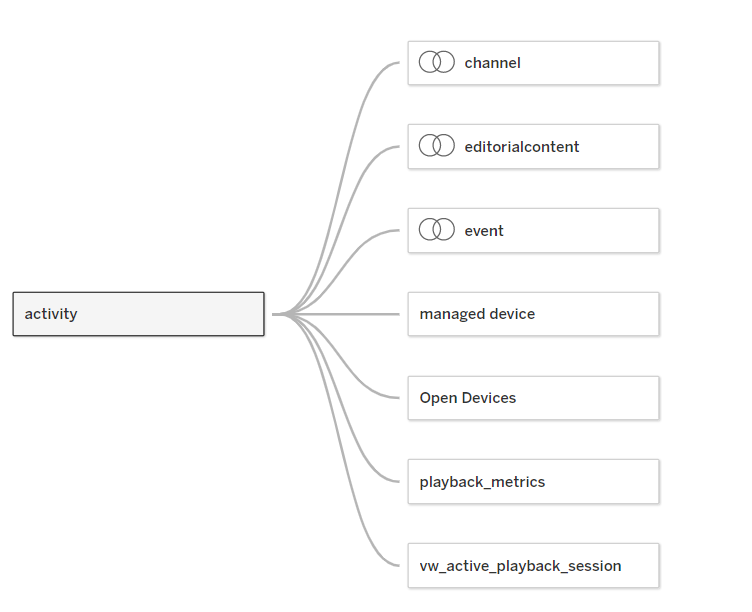
This data source is also available with different time filters at the data source level:
| Data source name | Time filter | Comments |
|---|---|---|
ds_ts_nxtGen_activity_based_data_today | Today | Includes data only for activities that were created today. |
ds_ts_nxtGen_activity_based_data_this_week | This week | Includes data only for activities that were created in the current running week. |
ds_ts_nxtGen_activity_based_data_this_month | This month | Includes data only for activities that were created in the current month. |
ds_ts_nxtGen_activity_based_data_this_quarter | This quarter | Includes data only for activities that were created in the current quarter. |
ds_ts_nxtGen_activity_based_data_this_year | This year | Includes data only for activities that were created in the current year. |
Analytics
Data source name: ds_ts_nxtGen_Analytics_Dataset
This is a generic data source that can be used for many different types of report.
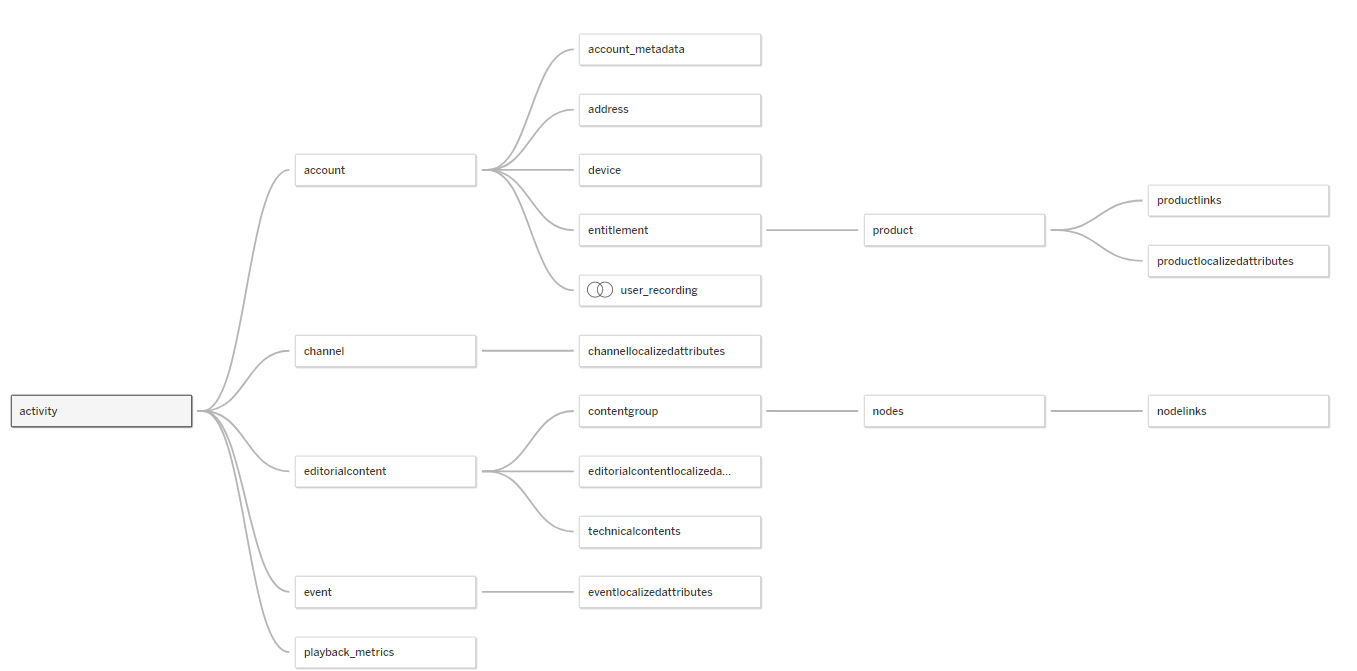
Legend
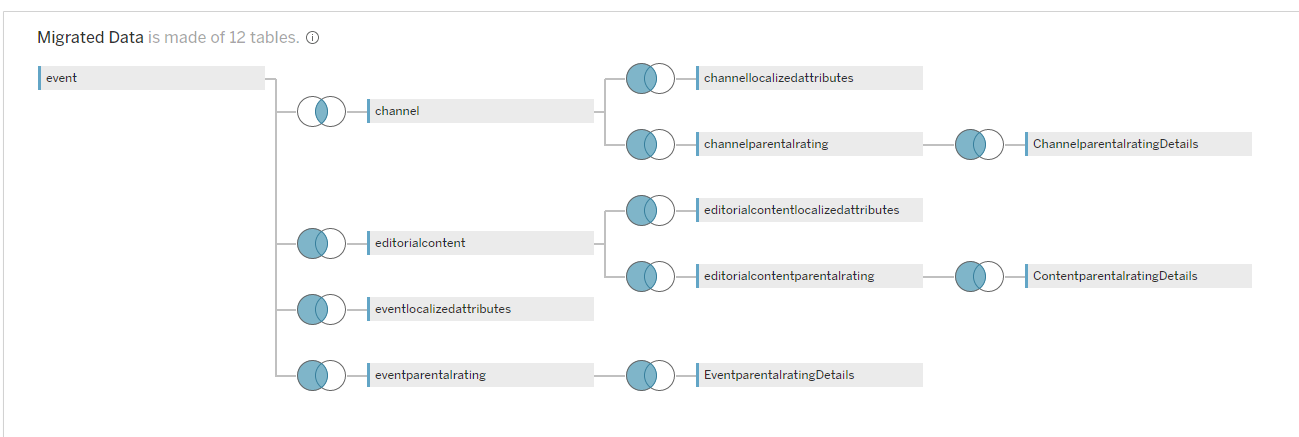
Joins
Inner join
The following symbol indicates an inner join:

This means that the result of the join includes only rows that correspond across the joined tables.
Left outer join
The following symbol indicates a left outer join:

This means that the result of the join includes all the rows from the left table and only the corresponding rows from the right table(s).
Relationships
The following diagram style represents relationships:

Multiple Data Source
Data source for the account, activity, device, entitlement, and product relationship:


Data source for the CPM entity – editorial content, event, and content group relationship:


Data source for the CPM entity – event, channel, and editorial content relationship:

Legend
Left Outer Join

When you use a left join to combine data, a query is sent to the database where the join is performed. A left join returns all rows from the left table and any corresponding rows from the right table.
The results of the join are then sent back to Tableau and aggregated for display in the visualisation.
A left join takes all rows from the left table and where there is corresponding information from the right table, that data is returned. Otherwise, there is a null.
Right Outer Join
N/A
Inner Join

When you use an inner join to combine tables, the result is a table that contains values that have matches in both tables.

