XML Ingestion Status
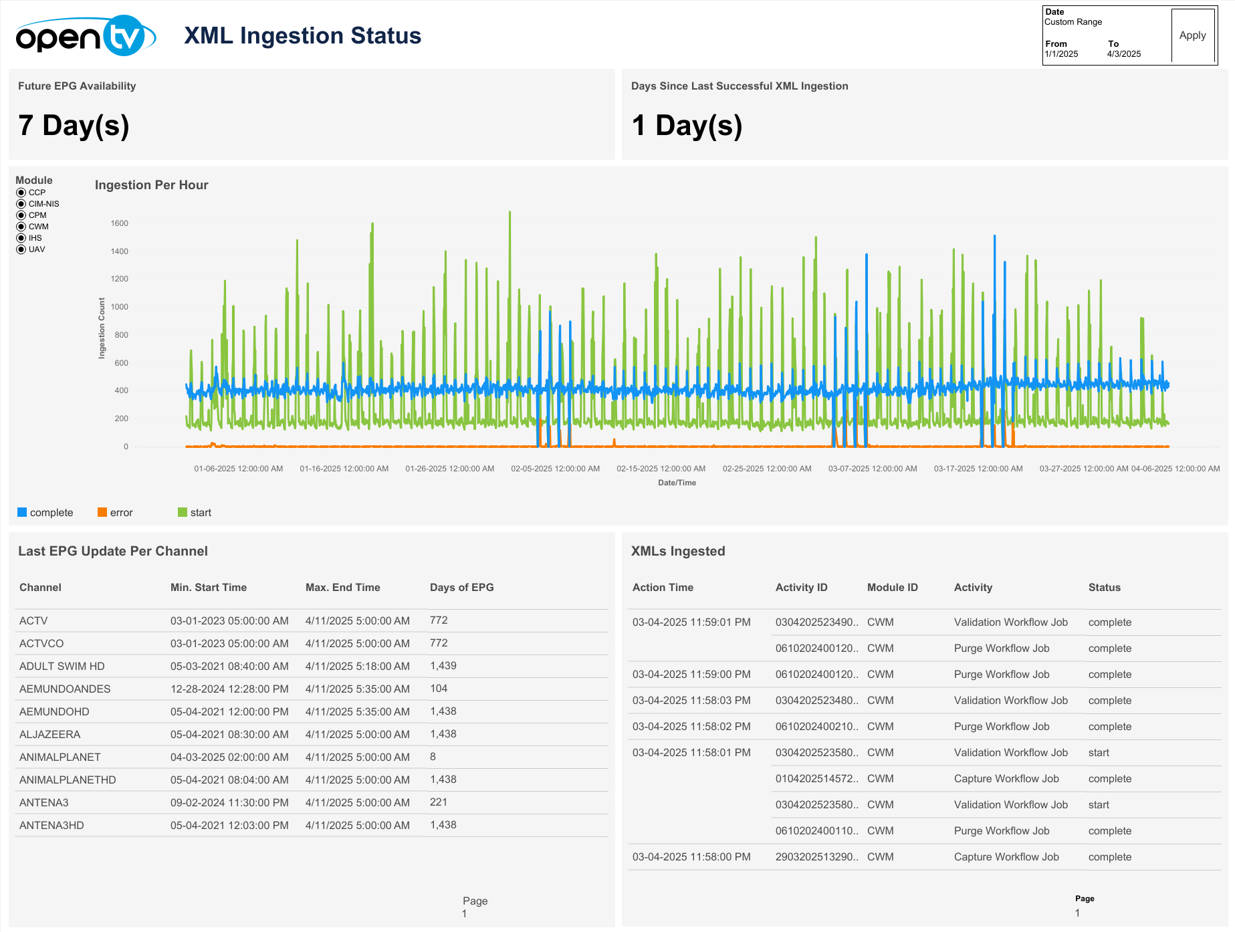
This page contains a chart showing ingestion count per hour within the selected time period, and two tables showing Last EPG Update Per Channel and XMLs Ingested.
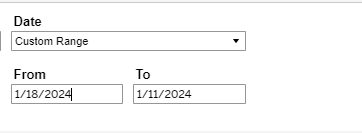
Date Select
The top right of the page shows a Date drop-down menu, with preset time intervals for Today, Yesterday, Last 7 days, Last 14 days, and Last 30 days. Selecting one of these options then clicking Apply loads the data.
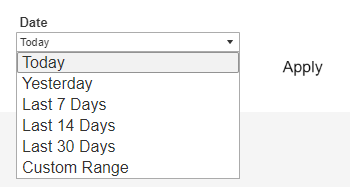
Users can also select Custom Range, which causes the From and To date fields to appear below, and allows users to specify any time interval (provided dates are not in the future). Users must then click Apply to load the data.
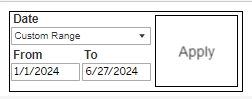
Selecting a From date that lies in the future causes the Apply button to disappear:
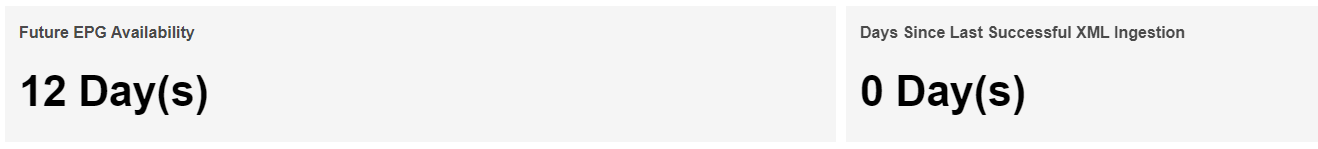
Below the report title and Date, the report shows tiles for Future EPG Availability and Days Since Last Successful XML Ingestion.
Ingestion Per Hour Chart
On the chart, users can:
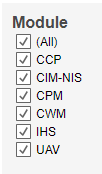
Filter data by module using the multi-select menu on the left:
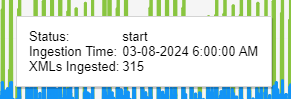
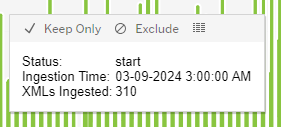
Mouseover or click the data/chart to show a tooltip with additional information.
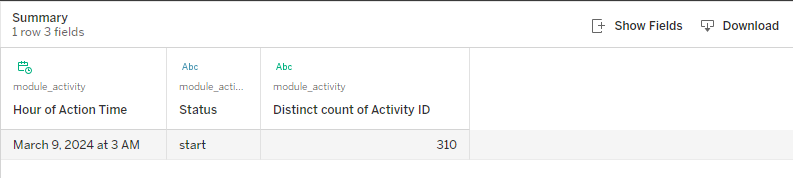
Click and continue hovering over the tile, then click to open the View Data window for the selected data category.
In this window, you can:
Change the sort order.
Show and hide fields.
Change the number of rows displayed.
Download the data in .csv format.
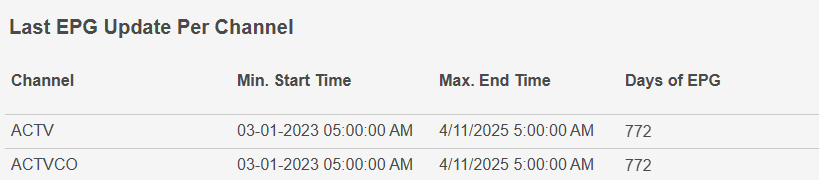
Last EPG Update Per Channel Table
The Last EPG Update Per Channel table shows columns for Channel, Min. Start Time, Max. End Time, and Days of EPG.
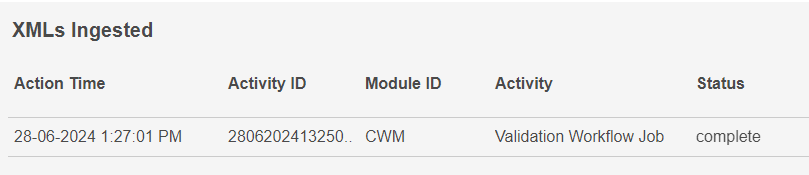
XMLs Ingested Table
The XMLs Ingested table shows columns for Action Time, Activity ID, Module ID, Activity, and Status.
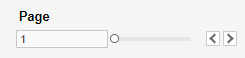
For each table, users can navigate between table pages by clicking or sliding the Page button to the bottom-right.