Ingest Purge Status
This page contains two charts:
The Purged Entities chart shows the number of entities purged by entity type, i.e., all purge activities.
The New Events / Content chart shows the number of Editorial Content and Events purged.
The Deleted Events / Content chart shows the number of Deleted Editorial Content and Event purged.

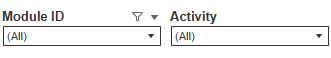
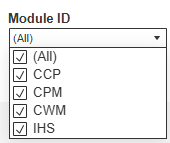
Drop-down filters
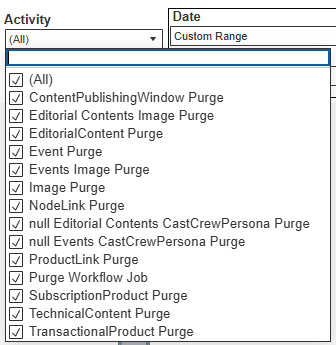
The top right side of this page contains drop-down menus for Module Id and Activity, allowing users to filter data by these criteria. Both drop-down menus supports muti-select options, and Activity drop down displays purge activities.
Date Select
The top right of the page shows a Date drop-down menu, with preset time intervals for Today, Yesterday, Last 7 days, Last 14 days, and Last 30 days. Selecting one of these options then clicking Apply loads the data.
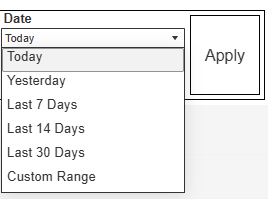
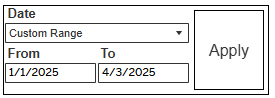
Users can also select Custom Range, which causes the From and To date fields to appear below, and allows users to specify any time interval (provided dates are not in the future). Users must then click Apply to load the data.
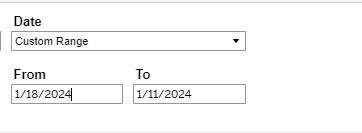
Selecting a From date that lies in the future causes the Apply button to disappear:
Purged Entities & New Events/Content Charts
On each chart, users can:
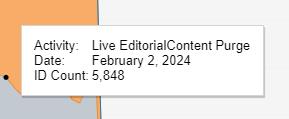
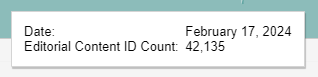
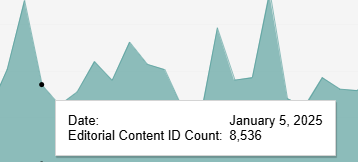
Mouseover or click the data/chart to show a tooltip with additional information.
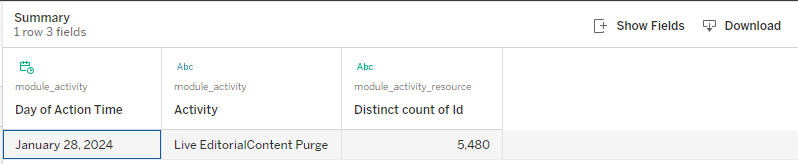
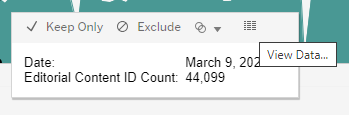
Click and continue hovering over the tile, then click to open the View Data window for the selected data category.
In this window, you can:
Change the sort order.
Show and hide fields.
Change the number of rows displayed.
Download the data in .csv format.