
Consumption KPI Dashboard
Overview
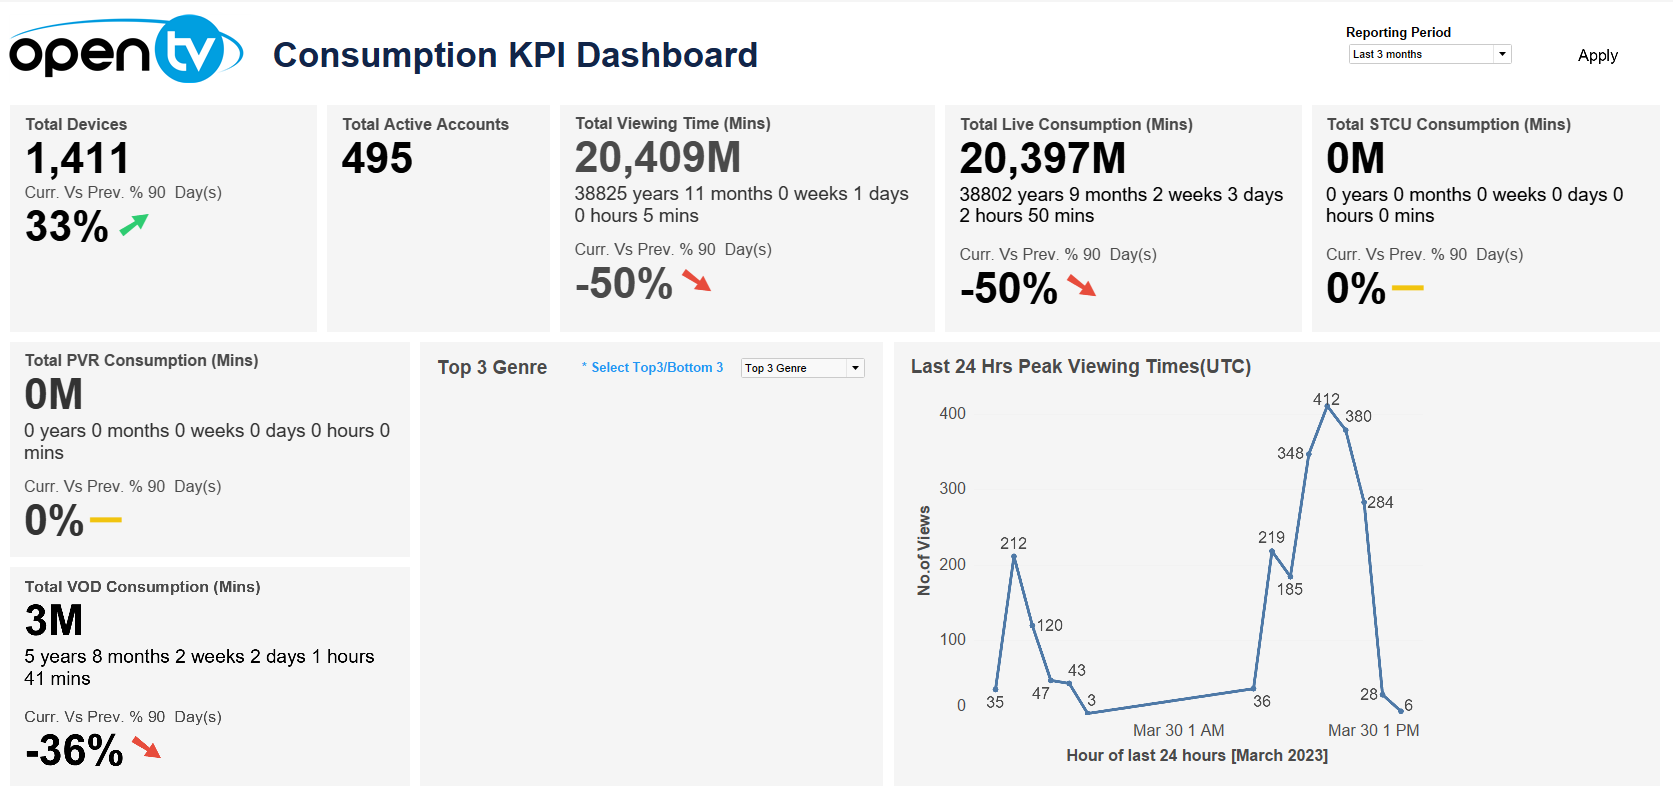
The Consumption KPI Dashboard displays a variety of consumption-related data, including:
- Total number of devices and change from previous period
- Total number of active accounts
- Total viewing time in minutes and change from previous period
- Total STCU consumption in minutes and change from previous period
- Total PVR consumption in minutes and change from previous period
- Total VOD consumption in minutes and change from previous period
- The top/bottom three genres shows the most or least popular genres by number of views
(Click Select Top 3/Bottom 3 to toggle between top three and bottom three.) The peak viewing times for the last 24 hours
Note that the date/time selection does not apply to this tile.
Hovering over the lower part of the tile shows + and - buttons that allow you to expand/contract the date range.
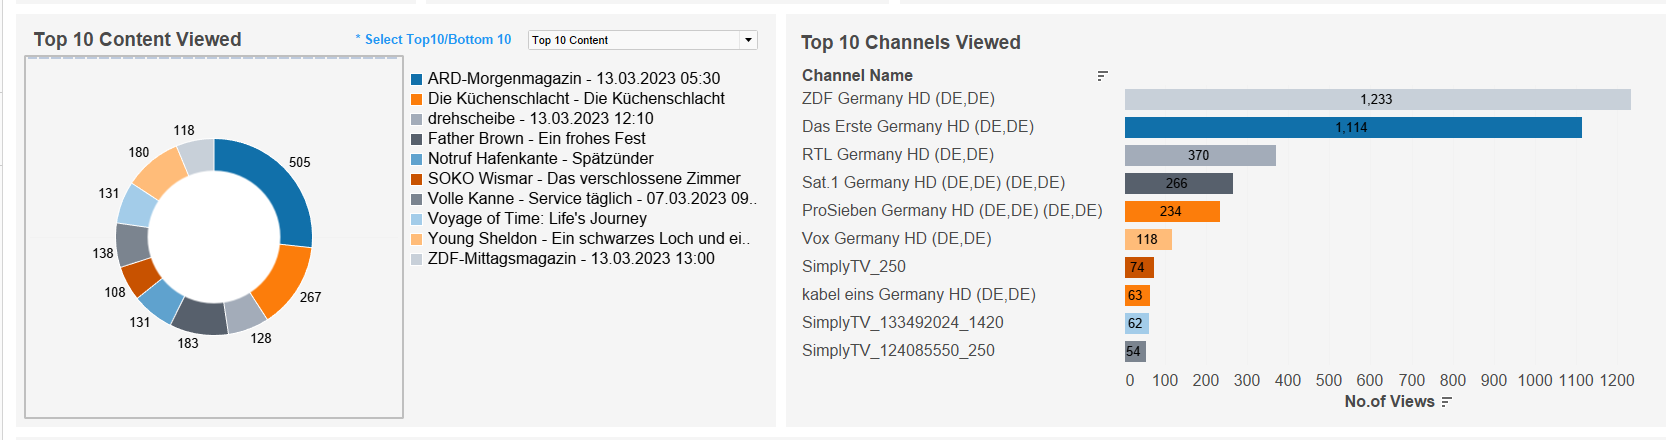
- Top/bottom 10 most/least viewed content
(Click Select Top 10/Bottom 10 to toggle between top three and bottom three.) - Top 10 most viewed channels
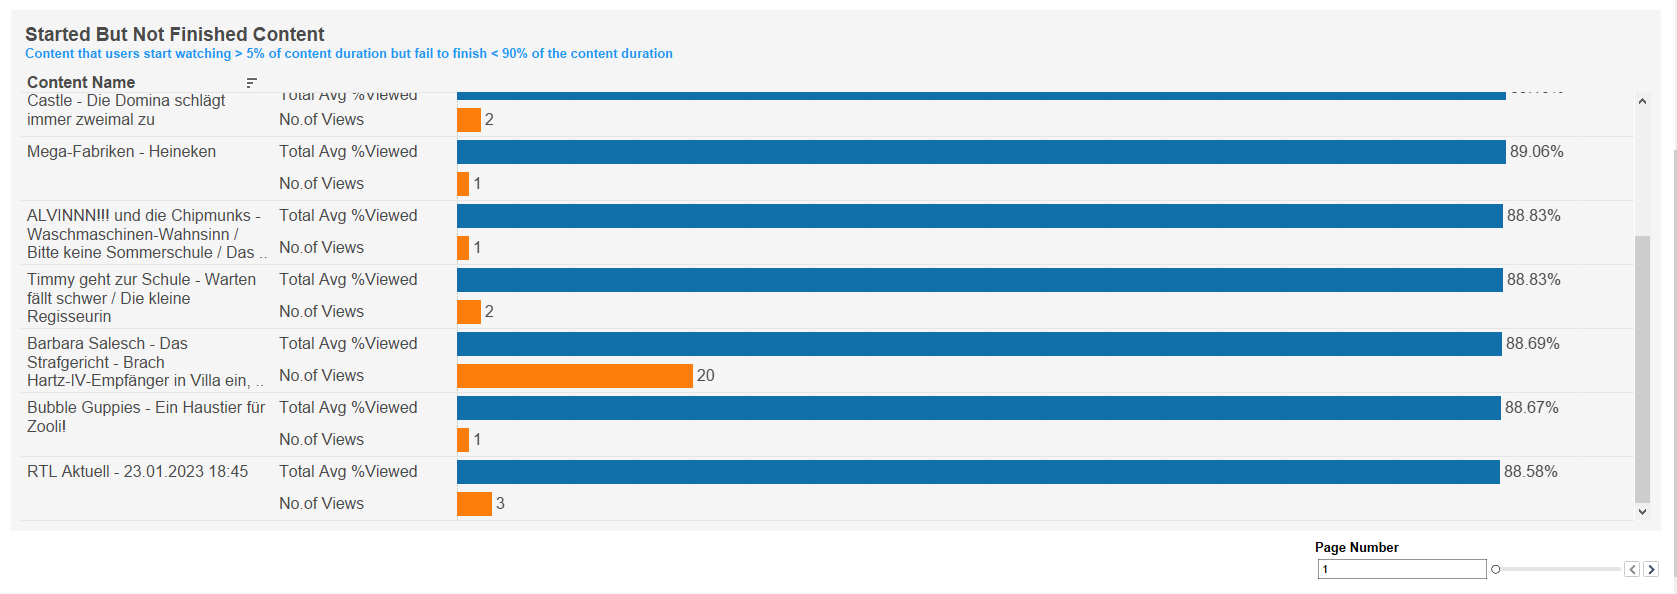
Chart of content that was not viewed until the end, ordered by average percentage viewed in descending order
Note that this shows the top 10 contents and has a pagination control for displaying subsequent pages.
At the top of the page, you can:
- Change the date range.
In each tile, you can:
- Hover over or click the data or chart to see additional information.
- Click and continue hovering over the tile, then click
 to open the View Data window for the selected data category.
In this window, you can:- See more detailed data, including (for some categories) a list of the accounts that comprise the total shown in the tile.
- Change the sort order.
- Show and hide fields.
- Change the number of rows displayed.
- Download the data.