
Account Dashboard
Account Dashboard | Overview
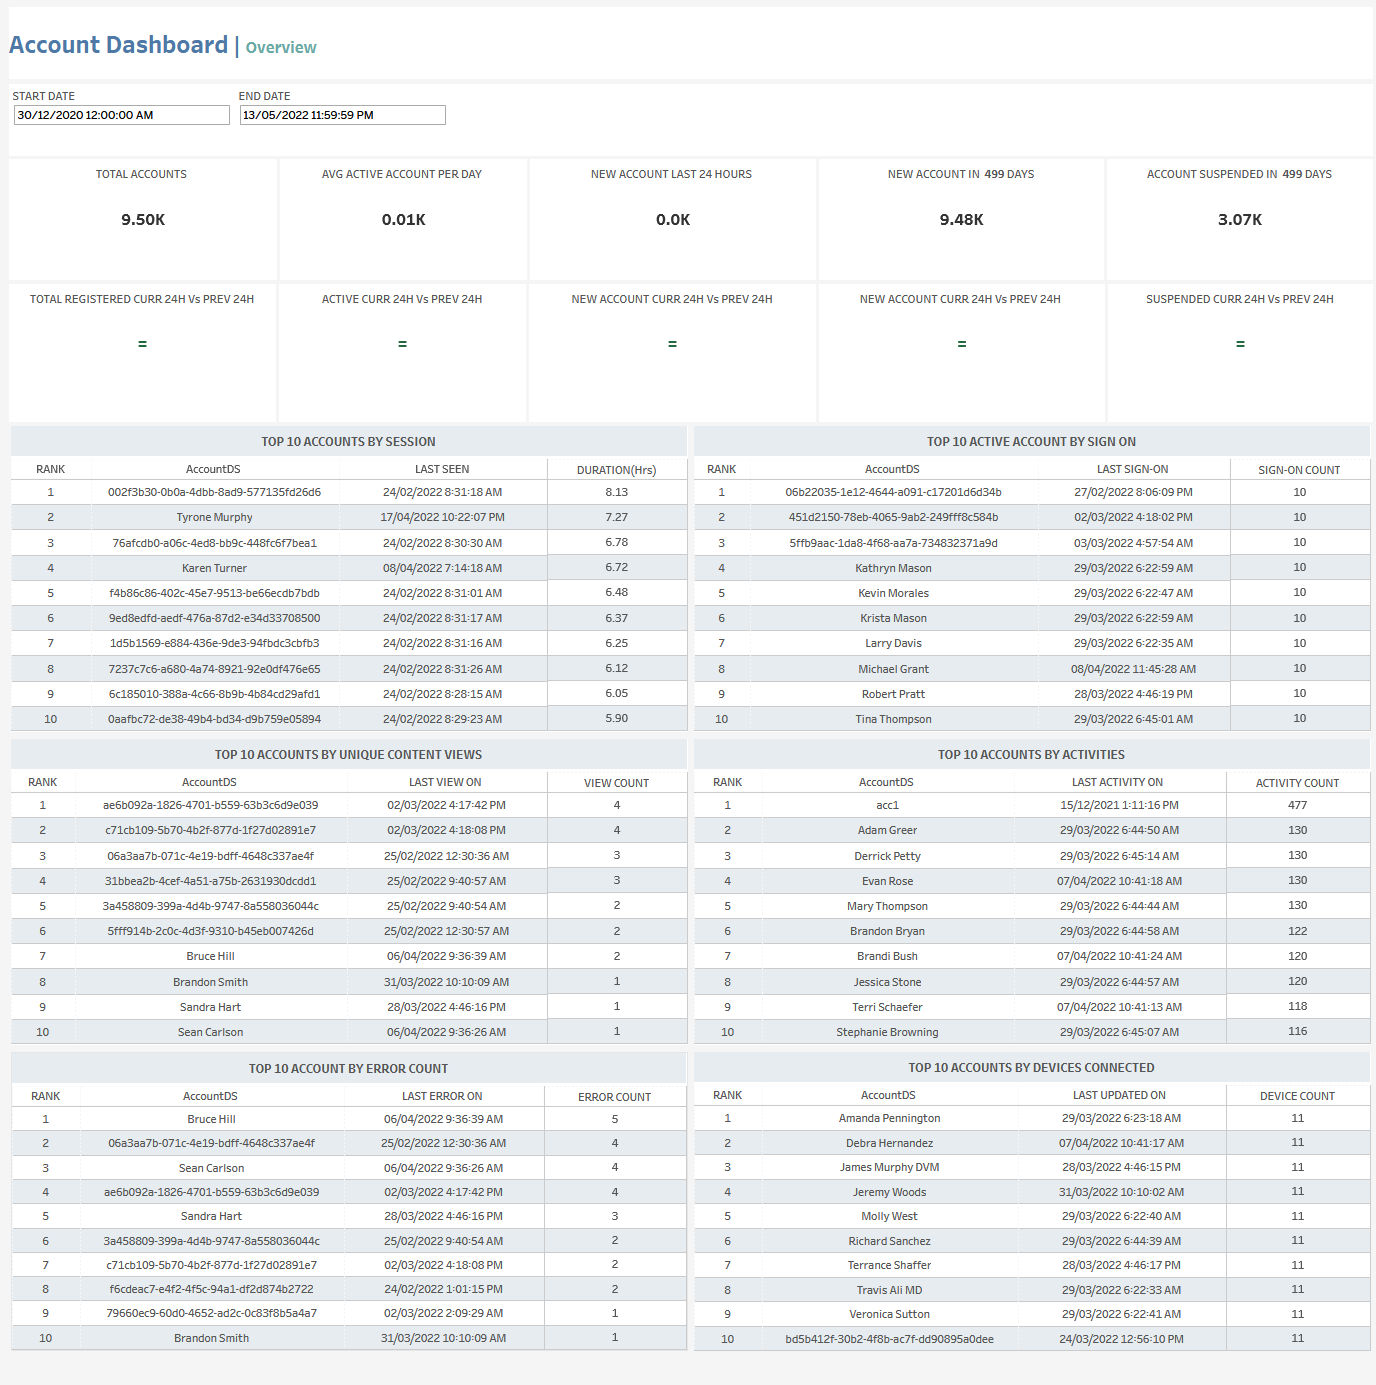
The Account Dashboard Overview tab lets you see a variety of account-related data for the selected time period, including:
- Total number of accounts
- Average number of active accounts per day
- Number of new accounts (for the last last 24 hours and for the selected time period)
- Number of account suspensions in the selected time period
- Comparisons of the following between the current 24-hour-period and the previous 24-hour period:
- Total registered accounts
- Active accounts
- New accounts
- Suspended accounts
- Top accounts by:
- Session duration
- Number of sign-ons
- Number of unique content views
- Number of activities
- Number of errors
- Number of connected devices
At the top of the page, you can:
- Change the date range
In the overview section, for each tile, you can:
- Hover over or click the tile to see exact numbers.
- Click the tile and then click
 to open the View Data window for the selected data category.
In this window, you can:- See more detailed data, including (for some categories) a list of the accounts that comprise the total shown in the tile.
- Change the sort order.
- Show and hide fields.
- Change the number of rows displayed.
- Download the data.
In the top accounts sections, you can click on a row to open the Account Details tab.
Account Dashboard | Details
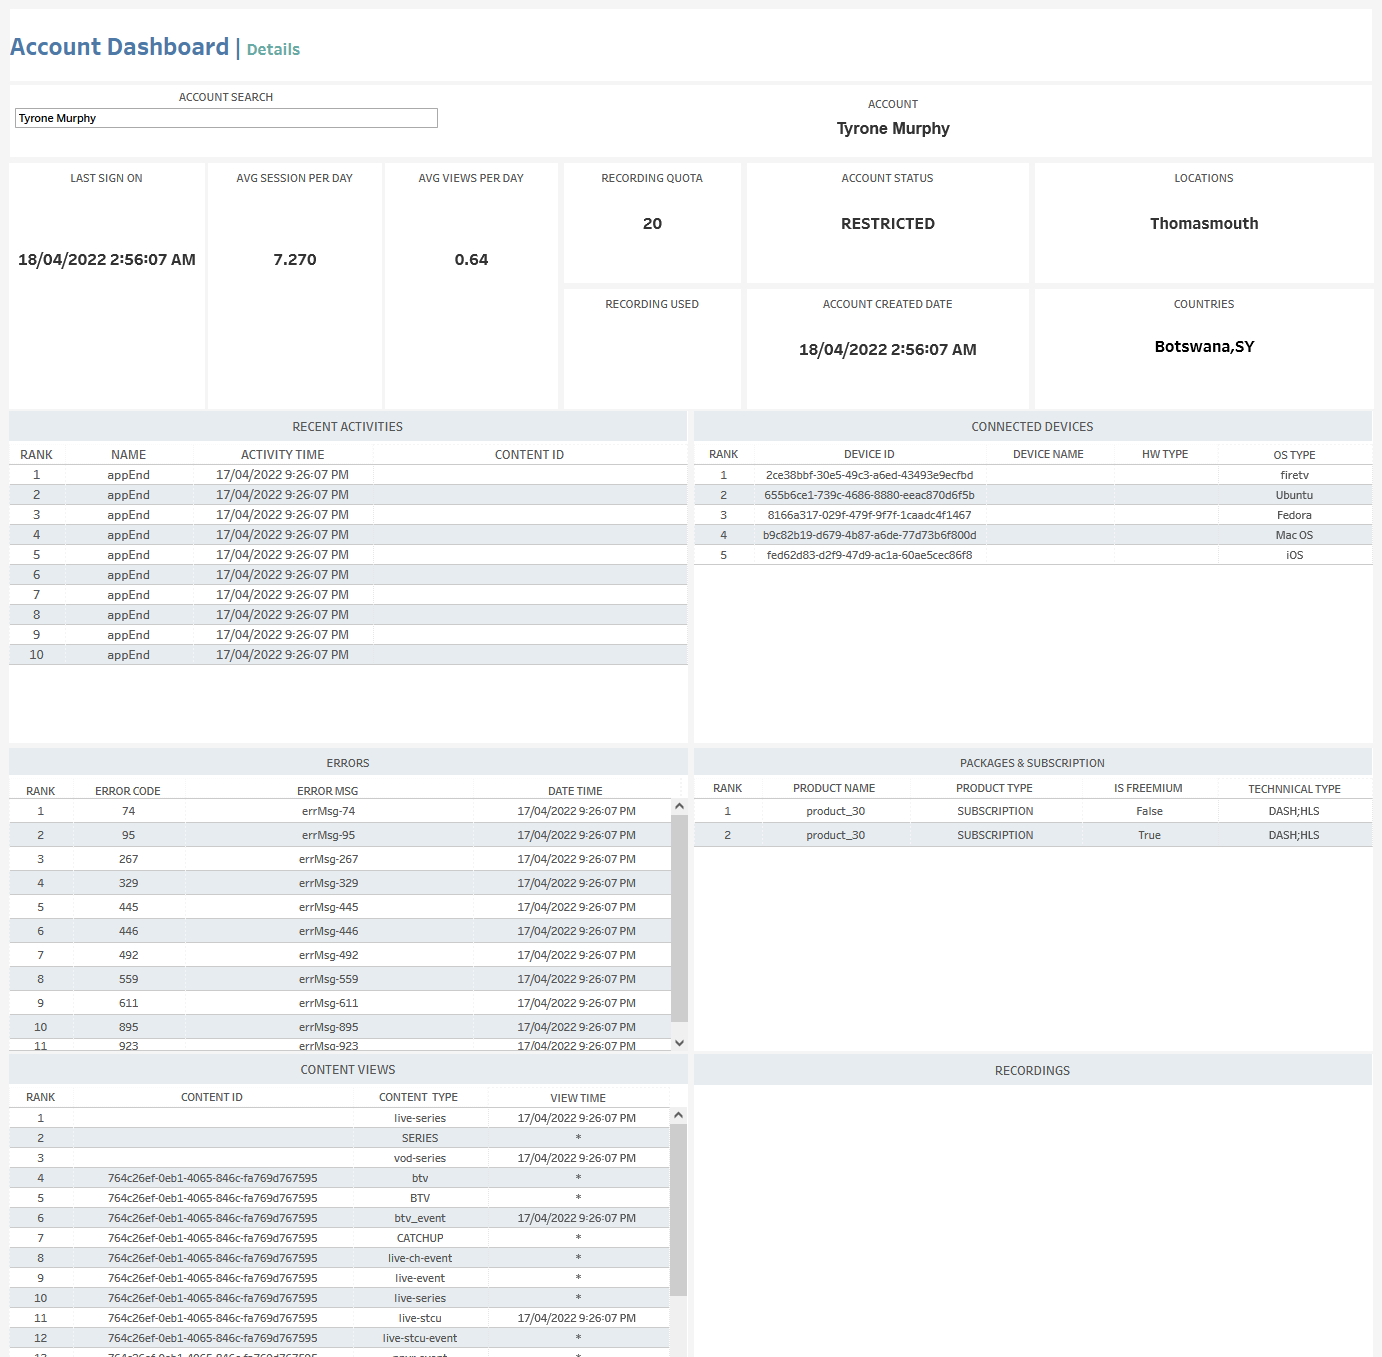
The Account Details tab shows detailed data for the selected account, including:
- Last sign-on time
- Average number of sessions per day
- Average number of views per day
- Recording quota size and usage
- Account status
- Account creation date
- Location
- Countries
- Recent activities
- Connected devices
- Errors
- Packages and subscriptions
- Content views
- Recordings
As in the Account Dashboard | Overview tab, you can click on any of these to open the View Data window, which shows more detailed data (see above).